Comments on China’s new emission cutting targets
chinagate.cn, July 3, 2015 Adjust font size:
D.If China can realize its 2030 targets proposed in the INDC, it will lay a solid foundation for China to further transform its development pathway to achieve the global goal of limiting warming within 2°C
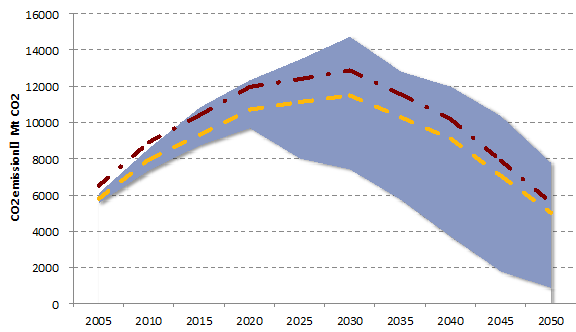
According to multiple scenarios with more than 50% probability to achieve the 2°C target in the IPCC’s Fifth Assessment Report which are consistent with China’s actual situation, the emission reduction requirement for China by 2030 is almost coherent with the emission reduction target China sets in its INDC. However, the key focus is on whether China could accelerate the pace of decarbonization after peaking in 2030. That is to say, if China could decarbonize at a faster rate after achieving its 2030 goals, it is possible that China’s long-term development pathway will meet the international goal of holding the increase in global average temperature below 2°C. As demonstrated in Figure 4, the dotted lines, standing for the simulated emission footprints under the INDC scenario (before and after energy data readjustment), fall right into the range (in purple shade) of multiple IPCC AR5 scenarios which are coherent with the 2°C temperature goal, in line with China’s actual situation. Since China’s INDC contains practical arrangements in technology, finance, policy mechanisms and capacity building geared towards an innovate development pathway, and it is committed to avoiding the lock-in effect of urbanization, infrastructure construction and high-carbon industry through scientific planning (urban spatial layout) and administrative orders (limiting increases in high-energy consumption industry), it is safe to conclude that through implementation of the INDC, China will build up its development philosophy, public opinion, policy and institutional reserve, technological reserve system, innovation capacity, capital stocks and flows, comprehensive and specialized capabilities, laying a solid foundation for transformation at a faster rate after 2030.
Figure 4 Relations between China’s INDC scenario and IPCC 2°C Scenario
Note and sources: the purple shade stands for a range of multiple possible scenarios from the IPCC AR5 scenario database (more than 50% probability to achieve 2°C goal) that meets China's actual situation, including scenarios developed by global models like GCAM, IMAGE, MERGE, MESSAGE, POLES, REMIND, TIAM-ECN, WITCH, etc. Scenarios with 2010 and 2015 emission levels which were very different to China's actual emissions were removed. The yellow dotted line stands for China's emissions trend when implementing INDC targets (without consideration of Chinese energy data adjustment in 2014), calculated with the PECE model developed by NCSC and Renmin University of China. The red line describes a rough trend taking into consideration the Chinese energy data adjustment in 2014. To make the data comparable with global data, the CO2 emissions include energy-related CO2 emissions plus CO2 emissions from cement production.
E.Through Implementation of its INDC, China’s cumulative emission level by 2030 will stay lower than the US and EU levels
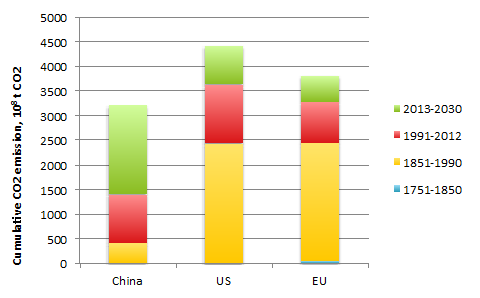
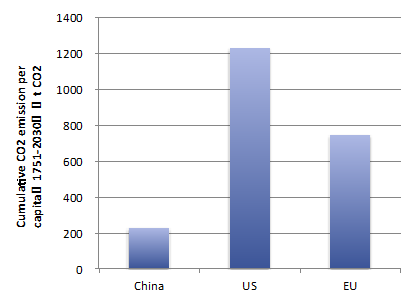
The IPCC Fifth Assessment Report confirmed the approximate linear relation between global warming and cumulative emissions. As demonstrated in Figure 5, for developed countries, the peaking period of their GHG emissions occurred throughout 1850 until 1990. During that period, their process of industrialization was marked by large amounts of GHG emissions. In China, CO2 emissions grew sharply since the mid-20th century, in particular from the rapid industrialization during the period of ‘reform and opening up’, which started around 1980. Under the INDC targets and through its innovate development pathway, China will be sure to maintain its cumulative energy-related CO2 emissions by 2030 lower than those of the US and the EU (at that time, the ratio of cumulative energy-related CO2 emissions among US, EU and China will be 1.4:1.2:1.0), even lower than the current (1751-2012) cumulative emission level of US and EU. China’s cumulative emissions per capita from 1751 to 2030 are projected to be much lower than the US and EU (18% and 30% respectively).
Figure 5-1 Cumulative CO2 emissions comparing China, US, and EU
Figure 5-2 Cumulative CO2 emissions per capita comparing China, US, and EU
Sources: only contains energy-related CO2 emissions. Data of historical CO2 emissions from 1960 to 2012 is quoted from CDIAC. Population and GDP information are cited from the World Bank. Data after 2012 is calculated based on INDC targets of each country.


