Comments on China’s new emission cutting targets
chinagate.cn, July 3, 2015 Adjust font size:
B.China’s emission reduction efforts after 2020 will be further strengthened compared to its 2020 commitments
Table 2 demonstrates that by the period of 2020-2030, the annual rate of decline of China’s CO2 emissions per unit of GDP will be further enhanced from 3.9% in the 2005-2020 period to 4.4%, with the potential to reach 6.3% in the 2030-2040 period and 9.2% in the 2040-2050 period. Meanwhile, China will speed up the deployment and construction of non-fossil energy projects, promoting an increase in the growth rate of non-fossil energy sources. By 2030, China’s installed capacity of non-fossil power is expected to increase by approximately another 900 gigawatts from the 2014 level, roughly equivalent to the country’s installed thermal power capacity in 2014, and much higher than U.S. and European levels over the same period (see Figure 2). Average annual installation of non-fossil power generation capacity will increase from 41.5 gigawatts in the period of 2005-2020 to 62.8 gigawatts during 2020-2030, and to 90 gigawatts in the 2040-2050 period.
Table 2 China’s action in reducing carbon intensity and developing non-fossil energy
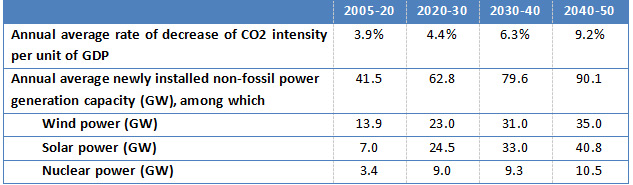
Sources: Developed based on INDC scenario study results calculated by the PECE model of NCSC and Renmin University of China. The carbon intensity and non-fossil target in 2020 are calculated as 45% and 15%, and in 2030 as 65% and 20%, respectively.
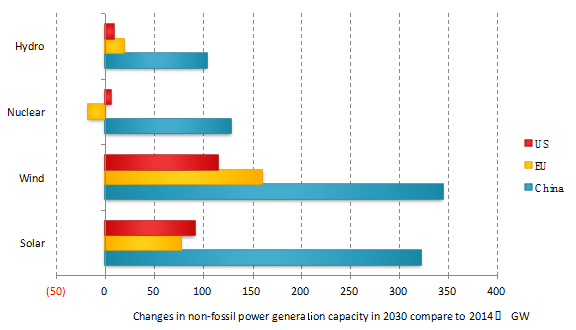
Figure 2 Change in non-fossil generation capacity in 2030 compared to 2014 (GW)
Source: Developed based on INDC scenario study results calculated by the PECE model of NCSC and Renmin University of China. U.S. and EU data are from World Energy Outlook 2015 Special Report by IEA, covering the change by 2030 over 2013.
C.As a country starting late in its development, China has the potential to achieve the following transformation through implementation of its INDC targets, and to achieve an innovative development pathway that will be less carbon-intensive and peak lower and earlier, with lower income levels than other developed countries
Seen from the historical CO2 emissions trajectory of major economies, there exists a Kuznets curve (an inverted ‘U’ curve) relation between economic development levels and CO2 emissions per capita, i.e., along with the increase of GDP per capita, the level of CO2 emissions per capita will experience continual growth until reaching a peak and then dropping. Although the level of emissions peaks vary, until today, no economy has avoided this trend of “dropping after growing”.
For major developed countries, their CO2 emissions per capita peaked at around 10-22 tons when their GDP per capita reached around 20,000-25,000 US dollars per annum (in 2010 price levels). Yet according to China’s targets set in the INDC, it is possible that China’s CO2 emissions per capita will peak at around 8 tons when its GDP per capita reaches around 14,000 US dollars. This is a major feature of China’s innovative development pathway as a country starting late in its development. If taking consideration of China’s position as the “world’s factory” and its abundant coal resources, it is likely that the peak values of consumption-based emissions and energy use will be lower than those of developed countries.
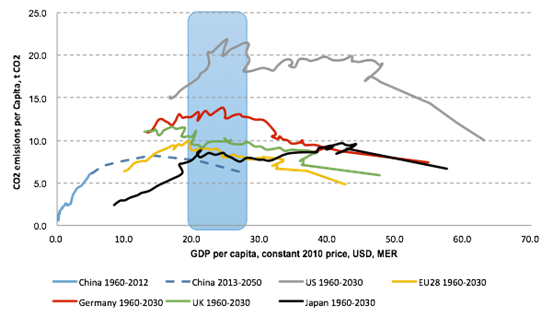
Figure 3 Trajectory of GDP and CO2 emissions per capita of major economies
Data sources: only contains energy related CO2 emissions. Data of historical CO2 emissions from 1960 to 2012 is quoted from CDIAC. Population and GDP information are cited from the World Bank. Data after 2012 is calculated based on INDC targets of each economy.