
Industrial Profits Increased from January to June
chinagate.cn, October 15, 2014 Adjust font size:
|
Key Financial Indicators of Industrial Enterprises above Designated Size from January to June |
||||||
|
Table I |
||||||
|
Indicators |
Revenue from Principal Business |
Total Profits |
Profits from Principal Business |
|||
|
Accumulated to June |
Increase rate Y/Y(%) |
Accumulated to June (100 million yuan) |
Increase rate Y/Y |
Accumulated to June |
Increase rate Y/Y |
|
|
Total |
514497.8 |
8.6 |
28649.8 |
11.4 |
26722.0 |
10.8 |
|
Of which: Mining and Quarrying |
31289.3 |
-1.3 |
3400.5 |
-14.6 |
3322.9 |
-15.8 |
|
Manufacturing |
452957.6 |
9.5 |
23010.8 |
15.6 |
21601.2 |
15.5 |
|
Production and Distribution of Electricity, Gas and Water |
30250.9 |
6.4 |
2238.5 |
22.3 |
1797.9 |
21.6 |
|
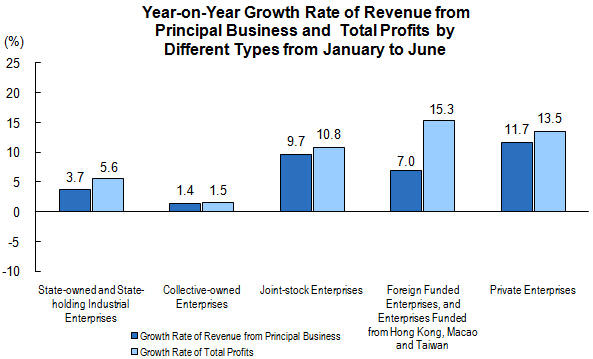
Of which: State Owned & State-holding Enterprises |
124747.6 |
3.7 |
7613.5 |
5.6 |
6226.6 |
2.3 |
|
Of which: Collective-owned Enterprises |
5245.3 |
1.4 |
349.0 |
1.5 |
348.7 |
-2.8 |
|
Joint-Stock Enterprises |
311443.7 |
9.7 |
16930.3 |
10.8 |
15695.7 |
10.0 |
|
Enterprises with Funds From Hong Kong, Macao and Taiwan, and Foreign Funded Enterprises |
121656.9 |
7.0 |
6917.6 |
15.3 |
6569.7 |
16.3 |
|
Of which: Private Enterprises |
167848.0 |
11.7 |
9104.9 |
13.5 |
9108.2 |
13.2 |
Note: Due to the overlap of economic type grouping, the total is not equal to the total of sub-items.
|
above Designated Size from January to June |
|||||
|
Table II |
|||||
|
Indicators |
Main Business Income Brought by per Hundred yuan Assets |
Main Business Income Margin |
Costs of Revenue from Principal Business for per Hundred yuan |
Turnover Days of Finished Goods |
|
|
(yuan) |
(%) |
(yuan) |
(days) |
||
|
Total |
121.5 |
5.57 |
85.94 |
13.8 |
|
|
Of which: Mining and Quarrying |
72.0 |
10.87 |
76.56 |
12.1 |
|
|
Manufacturing |
140.8 |
5.08 |
86.48 |
14.8 |
|
|
Production and Distribution of Electricity, Gas and Water |
52.1 |
7.40 |
87.55 |
0.5 |
|
|
Of which: State Owned & State-holding Enterprises |
74.2 |
6.10 |
82.59 |
15.1 |
|
|
Of which: Collective-owned Enterprises |
175.5 |
6.65 |
86.24 |
10.7 |
|
|
Joint-Stock Enterprises |
121.0 |
5.44 |
85.99 |
14.9 |
|
|
Enterprises with Funds From Hong Kong, Macao and Taiwan, and Foreign Funded Enterprises |
131.5 |
5.69 |
85.90 |
14.2 |
|
|
Of which: Private Enterprises |
191.8 |
5.42 |
87.64 |
11.5 |
|
|
Key Financial Indicators of Industrial Enterprises above Designated Size from January to June (Group by Industries) |
||||||
|
Table III |
||||||
|
Indicators |
Revenue from Principal Business |
Total Profits |
Profits from Principal Business |
|||
|
Accumulated to June |
Increase rate Y/Y |
Accumulated to June |
Increase rate Y/Y(%) |
Accumulated to June |
Increase rate Y/Y(%) |
|
|
Total |
514497.8 |
8.6 |
28649.8 |
11.4 |
26722.0 |
10.8 |
|
Mining and Washing of Coal |
14883.7 |
-6.7 |
613.1 |
-43.9 |
568.1 |
-46.6 |
|
Extraction of Petroleum and Natural Gas |
5811.0 |
3.2 |
1986.7 |
-2.3 |
1992.2 |
-2.4 |
|
Mining of Ferrous Metal Ores |
4456.8 |
4.0 |
360.5 |
-2.8 |
335.1 |
-9.7 |
|
Mining of Non-Ferrous Metal Ores |
2875.1 |
4.7 |
258.5 |
-14.2 |
261.8 |
-11.8 |
|
Mining And Processing of Nonmetal Ores |
2367.2 |
8.6 |
159.8 |
3.4 |
160.8 |
2.2 |
|
Processing of Food From Agricultural Products |
29094.7 |
9.1 |
1212.0 |
4.8 |
1209.7 |
5.8 |
|
Manufacture of Foods |
9337.1 |
12.7 |
721.6 |
12.7 |
692.2 |
11.9 |
|
Manufacture of Wines, Beverage and Refined Tea |
7814.1 |
9.4 |
761.6 |
1.4 |
745.1 |
1.5 |
|
Manufacture of Cigarettes And Tobacco |
4706.3 |
7.2 |
704.9 |
0.5 |
715.4 |
1.1 |
|
Manufacture of Textile |
17686.5 |
8.8 |
852.6 |
10.0 |
836.7 |
10.7 |
|
Manufacture of Textile Wearing Apparel And Ornament |
9390.8 |
9.8 |
495.5 |
13.9 |
482.5 |
15.3 |
|
Manufacture of Leather, Fur, Feather Aad Its Products |
6287.4 |
10.5 |
387.9 |
19.0 |
383.3 |
17.8 |
|
Processing of Timbers, Manufacture of Wood, Bamboo, Rattan, Palm, and Straw Products |
5952.7 |
12.6 |
342.3 |
14.2 |
347.2 |
9.3 |
|
Manufacture of Furniture |
3282.1 |
12.9 |
176.3 |
17.3 |
166.6 |
15.1 |
|
Manufacture of Paper and Paper Products |
6639.6 |
8.3 |
305.2 |
5.9 |
289.6 |
6.5 |
|
Printing, Reproduction of Recording Media |
2782.6 |
10.9 |
202.8 |
12.7 |
193.4 |
11.5 |
|
Manufacture of Articles for Culture, Education, Artwork, Sport and Entertainment Activity |
6214.3 |
8.6 |
297.1 |
17.9 |
291.0 |
18.4 |
|
Processing of Petroleum, Coking, Processing of Nucleus Fuel |
20220.9 |
2.8 |
173.0 |
122.7 |
159.8 |
138.2 |
|
Manufacture of Chemical Raw Material and Chemical Products |
39056.0 |
10.6 |
1764.6 |
10.4 |
1669.2 |
10.5 |
|
Manufacture of Medicines |
10797.4 |
13.5 |
1056.2 |
14.9 |
997.3 |
13.9 |
|
Manufacture of Chemical Fibres |
3403.7 |
4.1 |
95.6 |
19.6 |
84.7 |
16.7 |
|
Manufacture of Rubber and Plastics Products |
13942.8 |
10.9 |
789.1 |
11.9 |
786.6 |
12.1 |
|
Manufacture of Non-Metallic Mineral Products |
25868.5 |
13.0 |
1672.0 |
19.3 |
1607.1 |
20.6 |
|
Manufacture and Processing of Ferrous Metals |
37303.5 |
2.2 |
532.1 |
17.1 |
521.8 |
19.8 |
|
Manufacture and Processing of Non-Ferrous Metals |
23538.2 |
9.5 |
487.6 |
6.1 |
419.2 |
6.8 |
|
Manufacture of Fabricated Metal Products |
16357.2 |
10.9 |
796.7 |
13.8 |
803.4 |
15.2 |
|
Manufacture of General-Purpose Machinery |
21699.3 |
10.4 |
1357.5 |
13.5 |
1297.7 |
12.6 |
|
Manufacture of Special-Purpose Machinery |
16225.6 |
9.2 |
954.5 |
3.8 |
900.7 |
4.8 |
|
Manufacture of Motor Vehicles |
31991.6 |
14.9 |
2982.2 |
29.1 |
2461.7 |
28.3 |
|
Manufacture of Railway Locomotives, Building of Ships and Boats, Manufacture of Air and Spacecrafts and Other Transportation Equipments |
7008.5 |
14.1 |
388.2 |
29.0 |
361.4 |
32.1 |
|
Manufacture of Electrical Machinery and Equipment |
30885.6 |
10.5 |
1628.2 |
25.3 |
1505.7 |
26.0 |
|
Manufacture of Computer, Communication Equipment and Other Electronic Equipment |
38617.1 |
8.2 |
1476.5 |
24.1 |
1297.6 |
25.4 |
|
Manufacture of Measuring Instrument and Meter |
3758.8 |
12.5 |
284.8 |
13.3 |
267.0 |
15.9 |
|
Production and Supply of Electric Power and Heat Power |
27180.5 |
4.9 |
2010.8 |
24.1 |
1630.2 |
23.2 |
|
Production and Distribution of Gas |
2323.6 |
25.8 |
191.0 |
6.2 |
153.8 |
1.9 |
|
Production and Distribution of Water |
746.8 |
9.7 |
36.7 |
19.9 |
13.8 |
253.8 |
