
Industrial Production Operation in July 2014
chinagate.cn, October 15, 2014 Adjust font size:
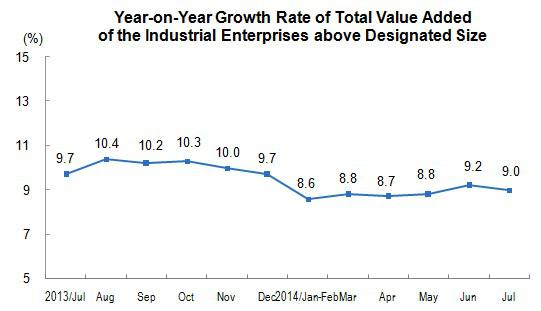
In July 2014, the total value added of the industrial enterprises above designated size was up by 9.0 percent year-on-year (the following growth rates of value added are real growth rates, after deducting price factors), 0.2 percentage points lower than that in June 2014. In July, the total value added of the industrial enterprises above designated size went up by 0.68 percent month-on-month. From January to July, the total value added of the industrial enterprises above designated size was up by 8.8 percent.
In view of three sectors, the value added of mining and quarrying increased 6.2 percent in July, that of manufacturing increased 10.0 percent, and that of production and distribution of electricity, gas and water was up by 1.9 percent, year-on-year.
Analysis on different types of enterprises showed that, in July, the year-on-year growth of the state-owned enterprises and state holding enterprises increased 5.8 percent, collective enterprises increased 4.4 percent, joint-stock enterprises increased 10.2 percent, enterprises funded by foreign investors or investors from Hong Kong, Macao and Taiwan province increased 6.3 percent.
Grouped by different sectors, in July, 39 industries within 41 industrial divisions kept year-on-year growth. Of this total, the growth of processing of food from agricultural products was 7.6 percent; the textile industry was up by 6.5 percent; the manufacture of raw chemical materials and chemical products, up by 11.5 percent; the manufacture of non-metallic mineral products, up by 10.2 percent; the ferrous metal smelting and pressing, up by 5.2 percent; the manufacture and processing of non-ferrous metals, up by 12.9 percent; the manufacture of general-purpose machinery, up by 11.9 percent; the manufacture of special-purpose machinery, up by 8.9 percent; the manufacture of automobile industry, up by 12.8 percent; the manufacture of railway locomotives, building of ships and boats, manufacture of air and spacecrafts and other transportation equipments, up by 16.6 percent; the manufacture of electric machinery and equipment, up by 9.9 percent; the manufacture of computer, communication equipment and other electronic equipment, up by 11.1 percent; the production and supply of electricity and heat, up by 0.9 percent.
In terms of different regions, in July, the value-added of eastern region increased 8.5 percent year-on-year; the central region went up by 8.9 percent; western region rose by 10.9 percent.
In terms of different products, many kinds of products in July showed a year-on-year growth. Of this total, the output of pig iron was 94.76 million tons, went up by 3.7 percent; that of cement was 222.97 million tons, up by 3.5 percent; that of 10 kinds of nonferrous metals was 3.63 million tons, up by 7.8 percent; that of ethylene was 1500 thousand tons, up by 11.7 percent; that of automobiles was 1858 thousand sets, up by 10.5 percent; that of cars was 1021 thousand sets, up by 6.8 percent; that of electricity was 504.8 billion kilowatt-hours, up by 3.3 percent; that of crude oil was 41.08 million tons, up by 2.0 percent.
The sales ratio of industrial products in July was 97.9 percent, 0.5 percentage points lower over the same period of last year. The total export delivery value of industrial enterprises was 985.2 billion yuan, a nominal year-on-year increase of 7.2 percent.
|
Industrial Production Operation in July 2014 |
||||
|
Indicators |
July |
Jan-Jul |
||
|
Absolute Value |
Increase rate Y/Y (%) |
Absolute Value |
Increase rate Y/Y (%) |
|
|
Value-added of Industry Above Designated Size |
… |
9.0 |
… |
8.8 |
|
Grouped by Three Sectors |
|
|
|
|
|
Mining and Quarrying |
… |
6.2 |
… |
5.0 |
|
Manufacturing |
… |
10.0 |
… |
9.9 |
|
Production and Distribution of Electricity, Gas and Water |
… |
1.9 |
… |
3.7 |
|
Grouped by Status of Registration |
|
|
|
|
|
State Owned & State-holding Enterprises |
… |
5.8 |
… |
5.5 |
|
Collective-Owned Enterprises |
… |
4.4 |
… |
3.4 |
|
Joint-Stock Enterprises |
… |
10.2 |
… |
10.2 |
|
Enterprises with Funds from Hong Kong, Macao and Taiwan, and Foreign Funded Enterprises |
… |
6.3 |
… |
7.1 |
|
The Value-Added of the Main Industrial Sectors |
|
|
|
|
|
Processing of Food from Agricultural Products |
… |
7.6 |
… |
8.5 |
|
Manufacture of Foods |
… |
10.8 |
… |
9.2 |
|
Manufacture of Textile |
… |
6.5 |
… |
6.9 |
|
Manufacture of Chemical Raw Material and Chemical Products |
… |
11.5 |
… |
11.0 |
|
Manufacture of Medicines |
… |
11.8 |
… |
13.2 |
|
Manufacture of Rubber and Plastics Products |
… |
9.9 |
… |
9.7 |
|
Manufacture of Nonmetal Mineral Products |
… |
10.2 |
… |
10.0 |
|
Manufacture of Ferrous Metal Smelting and Pressing |
… |
5.2 |
… |
6.7 |
|
Manufacture and Processing of Non-Ferrous Metals |
… |
12.9 |
… |
13.5 |
|
Manufacture of Fabricated Metal Products |
… |
12.8 |
… |
12.0 |
|
Manufacture of General Machinery |
… |
11.9 |
… |
10.2 |
|
Manufacture of Special-Purpose Machinery |
… |
8.9 |
… |
8.7 |
|
Manufacture of Motor Vehicles |
… |
12.8 |
… |
13.4 |
|
Manufacture of Railways, Shipbuilding, Aerospace and Other Transportation Equipment |
… |
16.6 |
… |
12.1 |
|
Manufacture of Electric Machinery and Equipment |
… |
9.9 |
… |
10.7 |
|
Manufacture of Computer, Communication Equipment and Other Electronic Equipment |
… |
11.1 |
… |
11.5 |
|
Production and Supply of Electricity, Gas and Water |
… |
0.9 |
… |
2.9 |
|
Output of Major Products |
|
|
||
|
Cloth (100 million meters) |
60 |
3.8 |
396 |
2.9 |
|
Sulfuric Acid(100%) (10,000 tons) |
736 |
10.6 |
5016 |
5.0 |
|
Caustic Soda(100%) (10,000 tons) |
260 |
11.8 |
1840 |
11.0 |
|
Ethylene (10,000 tons) |
150 |
11.7 |
996 |
6.2 |
|
Chemical Fiber (10,000 tons) |
371 |
5.9 |
2519 |
7.4 |
|
Cement (10,000 tons) |
22297 |
3.5 |
136893 |
3.7 |
|
Plate Glass (10 000 weight boxes ) |
6722 |
1.8 |
48334 |
6.2 |
|
Pig Iron (10,000 tons) |
5975 |
-0.6 |
42249 |
0.4 |
|
Crude Steel (10,000 tons) |
6832 |
1.5 |
48076 |
2.7 |
|
Steel Products (10,000 tons) |
9476 |
3.7 |
64723 |
5.8 |
|
10 Kinds Of Nonferrous Metals (10,000 tons) |
363 |
7.8 |
2443 |
5.9 |
|
Aluminium Oxide (10,000 tons) |
393 |
2.6 |
2670 |
5.9 |
|
Metal-Cutting Machine Tool |
7 |
6.1 |
50 |
4.6 |
|
Automobile (10,000 sets) |
185.8 |
10.5 |
1450.6 |
10.9 |
|
Saloon cars (10,000 sets) |
102.1 |
6.8 |
771.5 |
8.3 |
|
Generator Set (Power Generating Equipment) (10,000 kWh) |
1170 |
33.1 |
8338 |
8.6 |
|
Micro Computer Equipment (10,000 sets) |
2616 |
2.6 |
18706 |
6.8 |
|
Mobile Phone (10,000 sets) |
13981 |
10.1 |
98574 |
13.5 |
|
Integrated Circuit (100 000 000 pcs) |
94 |
11.3 |
578 |
11.2 |
|
Coke (10,000 tons) |
4024 |
2.8 |
27437 |
-0.5 |
|
Electricity (100 million kWh) |
5048 |
3.3 |
31249 |
5.5 |
|
Thermal Power |
3664 |
-3.2 |
24687 |
3.5 |
|
Hydro-electric Power |
1132 |
29.0 |
4848 |
13.6 |
|
Crude Oil (10,000 tons) |
4108 |
2.0 |
28430 |
2.8 |
|
Natural Crude Oil (10,000 tons) |
1734 |
1.1 |
12091 |
0.3 |
|
Natural Gas (million Cubic Meters) |
98 |
6.3 |
716 |
6.6 |
|
Sales Ratio (%) |
97.9 |
-0.5(percentage points) |
97.5 |
-0.1(percentage points) |
|
Export Delivery Value (100 million yuan) |
9852 |
7.2 |
66183 |
6.0 |
