
Total Retail Sales of Consumer Goods in July 2014
chinagate.cn, October 15, 2014 Adjust font size:
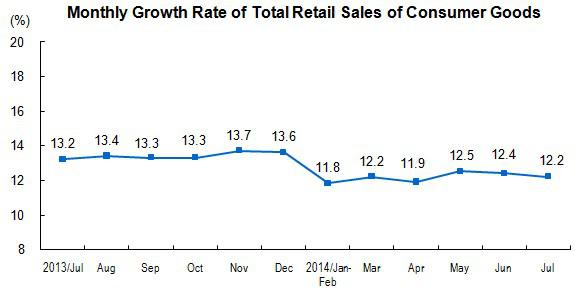
In July 2014, the total retail sales of consumer goods reached 2,077.6 billion yuan, up by 12.2 percent year-on-year (nominal growth rate. The real growth rate was 10.5 percent. The follows are nominal growth rates if there’s no additional explanation). Of the total, the retail sales of consumer goods of units above designated size was 1,036.0 billion yuan, increased 9.7 percent. From January to July, the total retail sales of consumer goods reached 14,497.4 billion yuan, up by 12.1 percent year-on-year. Of which, the online retail sales [1] of units above designated size was 216.7 billion yuan, increased 55.2 percent.
In terms of different areas, the retail sales of consumer goods in urban areas was 1,795.9 billion yuan in July, up by 12.1 percent, year-on-year; while that in rural areas was 281.7 billion yuan, up by 13.2 percent, year-on-year. From January to July, the retail sales of consumer goods in urban areas was 12,521.2 billion yuan, up by 12.0 percent, year-on-year; while that in rural areas was 1,976.3 billion yuan, up by 13.2 percent.
In terms of different consumption patterns, the catering services in July gained 218.7 billion yuan, up by 9.4 percent, year-on-year. The retail sales of goods gained 1,858.9 billion yuan, up by 12.6 percent. From January to July, the catering services gained 1,517.6 billion yuan, up by 10.0 percent, year-on-year; the retail sales of goods gained 12,979.9 billion yuan, up by 12.4 percent.
The retail sales amount of goods of units above designated size was 970.1 billion yuan, up by 10.3 percent. From January to July, the retail sales amount of goods of units above designated size was 6,800.2 billion yuan, up by 10.2 percent.
|
Total Retail Sales of Consumer Goods in July |
|||||
|
Item |
July |
Jan-Jul |
|||
|
Absolute Value (100 million yuan) |
Y/Y (%) |
Absolute Value (100 million yuan) |
Y/Y (%) |
||
|
Total Retail Sales of Consumer Goods |
20776 |
12.2 |
144974 |
12.1 |
|
|
Of Which: Retail Sales of the Enterprises (units) above Designated Size |
10360 |
9.7 |
72418 |
9.8 |
|
|
Grouped by Different Areas |
|
|
|
|
|
|
City |
17959 |
12.1 |
125212 |
12.0 |
|
|
At and Below County Level |
2817 |
13.2 |
19763 |
13.2 |
|
|
Grouped by Consumption Patterns |
|
|
|
|
|
|
Catering Services |
2187 |
9.4 |
15176 |
10.0 |
|
|
Of which: Income of Catering Services of the Enterprises (units) above Designated Size |
659 |
2.5 |
4415 |
2.9 |
|
|
Retail Sales of Goods |
18589 |
12.6 |
129799 |
12.4 |
|
|
Of which: Income of Retail Sales of Goods of the Enterprises (units) above Designated Size |
9701 |
10.3 |
68002 |
10.2 |
|
|
Of which: Grain, Oil, Foodstuff, Beverages, Tobacco and Liquor |
1292 |
10.2 |
9279 |
11.1 |
|
|
Garments, Footwear, Hats, Knitwear |
856 |
12.0 |
6728 |
10.3 |
|
|
Cosmetics |
136 |
12.9 |
1024 |
10.4 |
|
|
Gold, Silver and Jewelry |
203 |
-11.7 |
1689 |
-6.2 |
|
|
Commodities |
352 |
12.2 |
2384 |
10.5 |
|
|
Household Appliances and AV Equipment |
623 |
12.6 |
4158 |
8.6 |
|
|
Traditional Chinese and Western Medicines |
550 |
13.4 |
3785 |
14.7 |
|
|
Cultural and Office Appliances |
209 |
10.0 |
1349 |
11.7 |
|
|
Furniture |
182 |
16.0 |
1170 |
15.0 |
|
|
Communication Appliances |
205 |
24.2 |
1342 |
22.4 |
|
|
Petroleum and Related Products |
1697 |
11.3 |
11317 |
8.6 |
|
|
Automobile |
2610 |
8.1 |
18321 |
10.1 |
|
|
Building and Decoration Materials |
229 |
14.9 |
1421 |
14.8 |
|
|
Notes: 1.The growth rate in this table are all nominal growth rate. 2.For parts of data, the total is not equal to the total of sub-items due to round-off. | |||||
Note: [1] Online retail sales of units above designated size refers to the retail sales of consumer goods got by units above designated size, through public online trading platform (including self-built websites and third-party platform).
Annotations:
1. Explanatory Notes
Total Retail Sales of Consumer Goods: refers to the sales of physical commodity or the income of catering services sold or provided by enterprises (units) to individuals, social organizations for non-production and non-operation purposes.
2.Statistical Coverage
The corporate enterprises, industrial activity units or self-employed individuals which retail goods or provide catering services. Enterprises (units) above designated size refer to those wholesale enterprises (units) with an annual revenue from primary business of 20 million yuan and above, those retail enterprises (units) with an annual revenue from primary business of 5 million yuan and above, and those hotel and catering enterprises (units) with an annual revenue from primary business of 2 million yuan and above.
3. Survey Methods
All enterprises (units) above designated size are surveyed, while the data of enterprises (units) below designated size are collected by sampling survey.
4. Month-on-Month Figure Revision
According to the auto-revision function of the seasonal adjustment model, the growth rate of the total retail sales of consumer goods since June 2013 was revised. The revised figures and figures for June 2014 are as follows:
|
The Month-on-Month Growth Rate of Total Retail Sales of Consumer Goods | |
|
Months |
Growth Rate (%) |
|
2013-July |
1.08 |
|
August |
0.92 |
|
September |
1.05 |
|
October |
0.98 |
|
November |
1.01 |
|
December |
1.00 |
|
2014-January |
0.91 |
|
February |
0.51 |
|
March |
1.40 |
|
April |
0.81 |
|
May |
1.14 |
|
June |
0.95 |
|
July |
0.86 |
(Source: National Statistics Bureau website)
