
Industrial Production Operation in August 2014
chinagate.cn, October 15, 2014 Adjust font size:
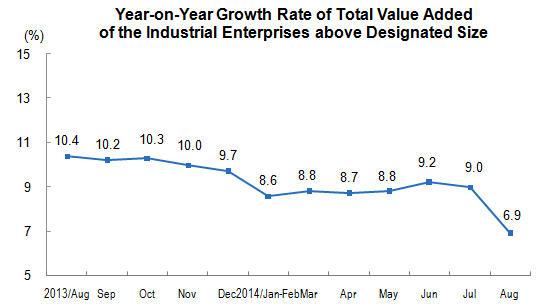
In August 2014, the total value added of the industrial enterprises above designated size was up by 6.9 percent year-on-year (the following growth rates of value added are real growth rates, after deducting price factors), 2.1 percentage points lower than that in July 2014. In August, the total value added of the industrial enterprises above designated size went up by 0.20 percent month-on-month. From January to August, the total value added of the industrial enterprises above designated size was up by 8.5 percent.
In view of three sectors, the value added of mining and quarrying increased 4.2 percent in August, that of manufacturing increased 8.0 percent, and that of production and distribution of electricity, gas and water was down by 0.6 percent, year-on-year.
Analysis on different types of enterprises showed that, in August, the year-on-year growth of the state-owned enterprises and state holding enterprises increased 4.0 percent, collective enterprises increased 1.2 percent, joint-stock enterprises increased 8.7 percent, enterprises funded by foreign investors or investors from Hong Kong, Macao and Taiwan province increased 3.8 percent.
Grouped by different sectors, in August, 37 industries within 41 industrial divisions kept year-on-year growth. Of this total, the growth of processing of food from agricultural products was 6.3 percent; the textile industry was up by 5.7 percent; the manufacture of raw chemical materials and chemical products, up by 8.9 percent; the manufacture of non-metallic mineral products, up by 8.9 percent; the ferrous metal smelting and pressing, up by 3.5 percent; the manufacture and processing of non-ferrous metals, up by 11.1 percent; the manufacture of general-purpose machinery, up by 9.8 percent; the manufacture of special-purpose machinery, up by 6.6 percent; the manufacture of automobile industry, up by 8.5 percent; the manufacture of railway locomotives, building of ships and boats, manufacture of air and spacecrafts and other transportation equipments, up by 16.1 percent; the manufacture of electric machinery and equipment, up by 8.3 percent; the manufacture of computer, communication equipment and other electronic equipment, up by 9.6 percent; the production and supply of electricity and heat, down by 1.7 percent.
In terms of different regions, in August, the value-added of eastern region increased 6.3 percent year-on-year; the central region went up by 7.1 percent; western region rose by 9.4 percent.
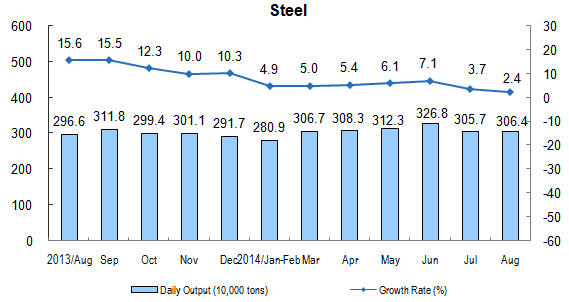
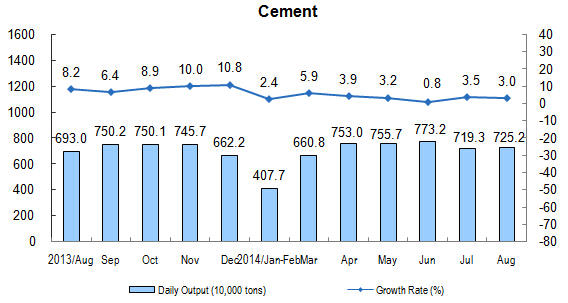
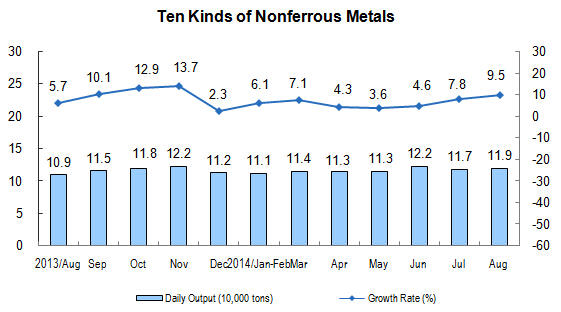
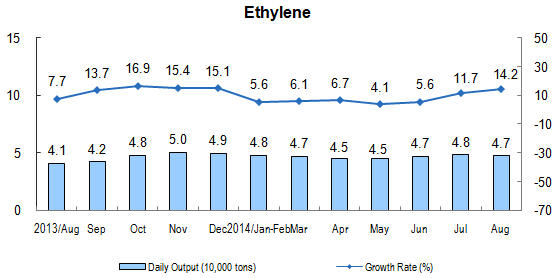
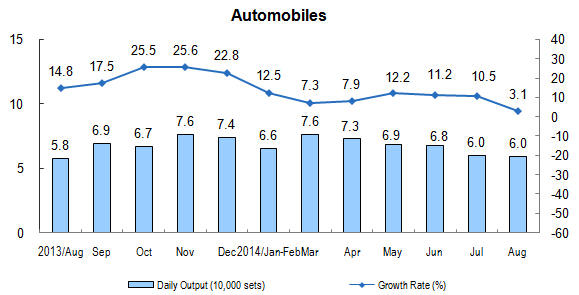
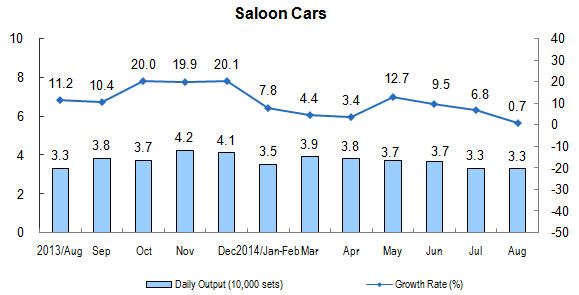
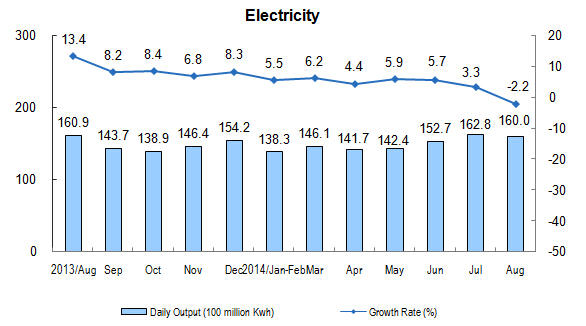
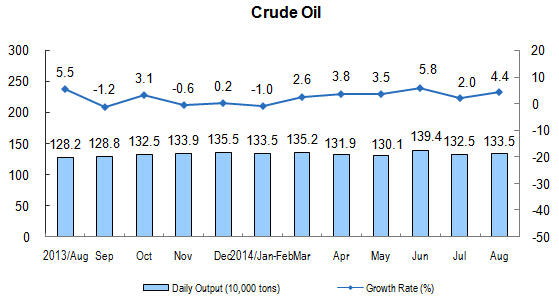
In terms of different products, many kinds of products in August showed a year-on-year growth. Of this total, the output of pig iron was 94.97 million tons, went up by 2.4 percent; that of cement was 224.80 million tons, up by 3.0 percent; that of 10 kinds of nonferrous metals was 3.70 million tons, up by 9.5 percent; that of ethylene was 1470 thousand tons, up by 14.2 percent; that of automobiles was 1846 thousand sets, up by 3.1 percent; that of cars was 1015 thousand sets, up by 0.7 percent; that of crude oil was 413.9 million tons, up by 4.4 percent; that of electricity was 495.9 billion kilowatt-hours, down by 2.2 percent;.
The sales ratio of industrial products in August was 98.2 percent, 0.1 percentage point lower over the same period of last year. The total export delivery value of industrial enterprises was 998.4 billion yuan, a nominal year-on-year increase of 5.5 percent.
|
Industrial Production Operation in August 2014 |
||||
|
Indicators |
August |
Jan-Aug |
||
|
Absolute Value |
Increase rate Y/Y (%) |
Absolute Value |
Increase rate Y/Y (%) |
|
|
Value-added of Industry Above Designated Size |
… |
6.9 |
… |
8.5 |
|
Grouped by Three Sectors |
|
|
|
|
|
Mining and Quarrying |
… |
4.2 |
… |
4.9 |
|
Manufacturing |
… |
8.0 |
… |
9.7 |
|
Production and Distribution of Electricity, Gas and Water |
… |
-0.6 |
… |
3.1 |
|
Grouped by Status of Registration |
|
|
|
|
|
State Owned & State-holding Enterprises |
… |
4.0 |
… |
5.3 |
|
Collective-Owned Enterprises |
… |
1.2 |
… |
3.1 |
|
Joint-Stock Enterprises |
… |
8.7 |
… |
10.0 |
|
Enterprises with Funds from Hong Kong, Macao and Taiwan, and Foreign Funded Enterprises |
… |
3.8 |
… |
6.7 |
|
The Value-Added of the Main Industrial Sectors |
|
|
|
|
|
Processing of Food from Agricultural Products |
… |
6.3 |
… |
8.2 |
|
Manufacture of Foods |
… |
6.9 |
… |
8.9 |
|
Manufacture of Textile |
… |
5.7 |
… |
6.7 |
|
Manufacture of Chemical Raw Material and Chemical Products |
… |
8.9 |
… |
10.7 |
|
Manufacture of Medicines |
… |
10.6 |
… |
12.9 |
|
Manufacture of Rubber and Plastics Products |
… |
7.0 |
… |
9.4 |
|
Manufacture of Nonmetal Mineral Products |
… |
8.9 |
… |
9.9 |
|
Manufacture of Ferrous Metal Smelting and Pressing |
… |
3.5 |
… |
6.3 |
|
Manufacture and Processing of Non-Ferrous Metals |
… |
11.1 |
… |
13.2 |
|
Manufacture of Fabricated Metal Products |
… |
11.9 |
… |
12.0 |
|
Manufacture of General Machinery |
… |
9.8 |
… |
10.1 |
|
Manufacture of Special-Purpose Machinery |
… |
6.6 |
… |
8.4 |
|
Manufacture of Motor Vehicles |
… |
8.5 |
… |
12.8 |
|
Manufacture of Railways, Shipbuilding, Aerospace and Other Transportation Equipment |
… |
16.1 |
… |
12.6 |
|
Manufacture of Electric Machinery and Equipment |
… |
8.3 |
… |
10.4 |
|
Manufacture of Computer, Communication Equipment and Other Electronic Equipment |
… |
9.6 |
… |
11.2 |
|
Production and Supply of Electricity, Gas and Water |
… |
-1.7 |
… |
2.3 |
|
Output of Major Products |
|
|
||
|
Cloth (100 million meters) |
59 |
2.1 |
453 |
2.9 |
|
Sulfuric Acid(100%) (10,000 tons) |
772 |
11.3 |
5763 |
5.6 |
|
Caustic Soda(100%) (10,000 tons) |
254 |
7.1 |
2089 |
10.3 |
|
Ethylene (10,000 tons) |
147 |
14.2 |
1141 |
7.1 |
|
Chemical Fiber (10,000 tons) |
364 |
3.6 |
2882 |
7.1 |
|
Cement (10,000 tons) |
22480 |
3.0 |
159237 |
3.5 |
|
Plate Glass (10 000 weight boxes) |
6403 |
-3.8 |
54770 |
5.0 |
|
Pig Iron (10,000 tons) |
6033 |
0.2 |
48325 |
0.5 |
|
Crude Steel (10,000 tons) |
6891 |
1.0 |
55010 |
2.6 |
|
Steel Products (10,000 tons) |
9497 |
2.4 |
74210 |
5.4 |
|
10 Kinds Of Nonferrous Metals (10,000 tons) |
370 |
9.5 |
2814 |
6.4 |
|
Aluminium Oxide (10,000 tons) |
390 |
1.9 |
3060 |
5.3 |
|
Metal-Cutting Machine Tool |
7 |
4.4 |
57 |
4.8 |
|
Automobile (10,000 sets) |
184.6 |
3.1 |
1634.8 |
9.9 |
|
Saloon cars (10,000 sets) |
101.5 |
0.7 |
873.3 |
7.4 |
|
Generator Set (Power Generating Equipment) (10,000 kWh) |
1404 |
26.3 |
9692 |
13.1 |
|
Micro Computer Equipment (10,000 sets) |
2674 |
-8.5 |
21216 |
2.3 |
|
Mobile Phone (10,000 sets) |
13642 |
-2.3 |
112258 |
11.2 |
|
Integrated Circuit (100 000 000 pcs) |
93 |
7.5 |
662 |
8.8 |
|
Coke (10,000 tons) |
3992 |
1.4 |
31429 |
-0.3 |
|
Electricity (100 million kWh) |
4959 |
-2.2 |
36200 |
4.4 |
|
Thermal Power |
3528 |
-11.3 |
28215 |
1.4 |
|
Hydro-electric Power |
1178 |
37.2 |
6012 |
17.2 |
|
Crude Oil (10,000 tons) |
4139 |
4.4 |
32763 |
3.6 |
|
Natural Crude Oil (10,000 tons) |
1749 |
0.9 |
13840 |
0.1 |
|
Natural Gas (million Cubic Meters) |
99 |
8.0 |
814 |
6.7 |
|
Sales Ratio (%) |
98.2 |
-0.1(percentage points) |
97.6 |
-0.1(percentage points) |
|
Export Delivery Value (100 million yuan) |
9984 |
5.5 |
76118 |
5.8 |
Annotations:
1. Explanation of Indicator.
Growth rate of value added of the industrial enterprises: also known as industrial growth rate, which is used to reflect a certain period of increase or decrease in volume of industrial production indicators of the degree of change. The indicator can be used to estimate the short-term trend of the industrial economy, to judge the extent of the economic boom, and also to be an important reference and basis for the formulation and adjustment of economic policies, and for the implementation of macroeconomic adjustment and control.
Sales ratio: refers to sale value and industrial output value, which reflecting the situation between production and sales of industrial products.
Export delivery value: refers to the foreign trade department of industrial enterprises or self-run (commission) exports (including sold in Hong Kong, Macao and Taiwan), with the price of foreign exchange settlement of product value, and foreign samples, materials processing, component assembly and compensation trade product value. In calculating the export delivery value, the transaction price of foreign exchange should be converted into RMB.
Daily product output: the total production of the total value added of the industrial enterprises above designated size in the current month divided by number of days in the month.
The year-on-year growth rate of product output: as industrial enterprises above designated size range will be some changes each year, according to the regulations of NBS, the data in the same period of previous year were required when enterprises submit monthly data. Hence, the year-on-year growth rate of product output was calculated by the current total value added of the industrial enterprises above designated size divided by the data submitted at the same time period.
2. Statistical Coverage.
From 2011 on, the standard starting point of industrial enterprises above designated size was adjusted to 20 million yuan of annual revenue from primary business, the former one was 5 million yuan.
3. Data Collection.
The reports of industrial enterprises above designated size are conducted with complete survey on a monthly basis (Not report for January).
4. Division on Eastern, Central and Western Regions.
Eastern region includes Beijing, Tianjin, Hebei, Liaoning, Shanghai, Jiangsu, Zhejiang, Fujian, Shandong, Guangdong, and Hainan. Central region includes Shanxi, Jilin, Heilongjiang, Anhui, Jiangxi, Henan, Hubei, and Hunan. Western region includes Inner Mongolia, Guangxi, Chongqing, Sichuan, Guizhou, Yunnan, Tibet, Shaanxi, Gansu, Qinghai, Ningxia, and Xinjiang.
5. Standard on industrial classification
From 2012, NBS enforces New Standard on Industrial Classification for National Economic Activities" (GB/T4754-2011). The number of industrial sectors expanded from 39 to 41. For details, please refer the following link: http://www.stats.gov.cn/tjsj/tjbz/hyflbz.
6. Revision on month-on-month data
The month-on-month growth rate of the total value added of the industrial enterprises above designated size from August 2013 to July 2014 was revised according to the results of automatic revision of seasonal adjustment model. The results and data in August 2014 is as follows:
|
The Month-on-Month Growth Rate of Industrial Production Operation |
|
|
Months |
Growth Rate (%) |
|
2013-August |
1.09 |
|
September |
0.65 |
|
October |
0.75 |
|
November |
0.66 |
|
December |
0.63 |
|
2014-January |
0.55 |
|
February |
0.56 |
|
March |
0.76 |
|
April |
0.62 |
|
May |
0.62 |
|
June |
0.69 |
|
July |
0.62 |
|
August |
0.20 |
(Source:National Statistics Bureau website)
