
China's Non-manufacturing PMI Decreased in September
chinagate.cn, October 15, 2014 Adjust font size:
Department of Service Statistics of NBS
China Federation of Logistics and Purchasing (CFLP)
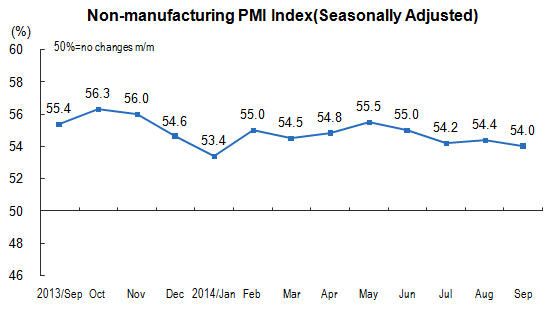
In September 2014, non-manufacturing purchasing manager index was 54.0 percent, decreased 0.4 percentage points over the previous month, still 4.0 percentage points higher than the threshold, indicating that China's non-manufacturing sector continued to maintain growth.
In view of different industries, non-manufacturing purchasing manager index of service industry was 52.5 percent, down by 1.1 percentage points than that in the previous month. Of which, the indices of post, retail trade, Internet, software and information technology services, telecommunications, broadcasting, television and satellite transmission services were above the threshold, and the total enterprise business increased; the indices of air transport, restaurants, water transport, ecological protection, environmental control and management of public facilities, real estate were below the threshold, and the total enterprise business decreased. Non-manufacturing purchasing manager index of construction industry achieved 60.2 percent, up by 2.5 percentage points over the previous month, indicating that the total enterprise business of construction industry continued to grow.
New orders index fell below the threshold. The new orders index was 49.5 percent, down by 0.5 percentage points over the previous month, dropped below the threshold. In view of different industries, the new orders index of service industry was 49.4 percent, decreased 1.2 percentage points over the previous month. Of which, the new orders indices of post, retail trade, Internet, software and information technology services, telecommunications, broadcasting, television and satellite transmission services were above the threshold, and the market demands increased; while the new orders indices of ecological protection, environmental control and management of public facilities, air transport, real estate, restaurants were below the threshold, and the market demands decreased. The new orders index of construction industry was 50.0 percent, increased 2.5 percentage points over the previous month, and stayed at the threshold, the market demands showed little change compared with the previous month.
Intermediate input price index continued to fall back, which reached 49.8 percent, down by 2.4 percentage points over last month, fell below the threshold, indicating the intermediate input price during the process of production and operation of non-manufacturing enterprises went down. In view of different industries, the intermediate input price index of service industry was 50.1 percent, down by 2.4 percentage points over the previous month. Of which, the intermediate input price indices of restaurants, accommodation, retail trade, resident services and repair, post were above the threshold, and the overall level of intermediate input price increased; while the intermediate input price indices of water transport, air transport, wholesale were below the threshold, and the overall level of intermediate input price decreased. The intermediate input price index of construction industry was 48.9 percent, a decrease of 2.1 percentage points over the previous month, and had decreased for 3 consecutive months, fell below the threshold this month, indicating the overall level of intermediate input price of construction enterprises turned to decrease from increase.
The subscription price index continued to decline. This index was 47.3 percent, 1.0 percentage point lower over last month, showing that the overall level of non-manufacturing subscription price continued to decrease. In view of different industries, the subscription price index of service industry was 46.8 percent, a decrease of 1.1 percentage points over the previous month, and only the subscription price indices of accommodation, retail trade were higher than the threshold. The subscription price index of construction industry was 49.1 percent, down by 0.9 percentage points over last month, stayed below the threshold, and the subscription price was lower over last month.
Employment index decreased slightly. This index was 49.5 percent, 0.1 percentage point lower over the previous month. In view of different industries, the employment index of service industry was 49.0 percent, kept at the same level over the previous month. Of which, the employment index of air transport, transport via railway, Internet, software and information technology services, transport via road were above the threshold; while that of accommodation, restaurants, loading, unloading and portage, storage, resident services and repair were below the threshold. The employment index of construction industry was 51.4 percent, down by 0.4 percentage points over last month, still stayed above the threshold.
Business activities expectation index continued to drop. This index was 60.9 percent, went down by 0.3 percentage points over last month, but still positioned in the high level of the range, indicating that the non-manufacturing enterprises maintained optimistic about the operating expectation in next three months. In view of different industries, except that the business activities expectation index of renting and leasing activities and business services was lower than the threshold, that of other industries all positioned in the expansion interval.
|
China's Non-manufacturing PMI (Seasonally adjusted) | ||||||
|
Unit: % | ||||||
|
|
Non-manufacturing PMI |
New Orders Index |
Intermediate Input Price Index |
Subscription Price Index |
Employment index |
Business Activities Expectation Index |
|
2013-September |
55.4 |
53.4 |
56.7 |
50.6 |
51.3 |
60.1 |
|
October |
56.3 |
51.6 |
56.1 |
51.4 |
51.5 |
60.5 |
|
November |
56.0 |
51.0 |
54.8 |
49.5 |
51.9 |
61.3 |
|
December |
54.6 |
51.0 |
56.9 |
52.0 |
51.1 |
58.7 |
|
2014-January |
53.4 |
50.9 |
54.5 |
50.1 |
49.7 |
58.1 |
|
February |
55.0 |
51.4 |
52.1 |
49.0 |
50.9 |
59.9 |
|
March |
54.5 |
50.8 |
52.8 |
49.5 |
51.4 |
61.5 |
|
April |
54.8 |
50.8 |
52.4 |
49.4 |
50.2 |
61.5 |
|
May |
55.5 |
52.7 |
54.5 |
49.0 |
50.9 |
60.7 |
|
June |
55.0 |
50.7 |
56.0 |
50.8 |
50.4 |
60.4 |
|
July |
54.2 |
50.7 |
53.4 |
49.5 |
49.3 |
61.5 |
|
August |
54.4 |
50.0 |
52.2 |
48.3 |
49.6 |
61.2 |
|
September |
54.0 |
49.5 |
49.8 |
47.3 |
49.5 |
60.9 |
Annotations:
1. Explanatory Notes
China non-manufacturing purchasing manager index system constituted by 10 sub-indices, they are business activity index, new orders index, new export orders index in hand orders index, stock index, intermediate input price index, subscription price index, employment index, supplier delivery time index, and business activities expectation index. Due to the lack of synthesis of non-manufacturing integrated PMI index, the international society often used business activity index to reflect the overall changes in non-manufacturing economic development, A PMI reading above 50 percent indicates expansion from the previous month, while below indicates contraction.
2. Statistical Coverage
The survey involves 27 non-manufacturing industry categories in the “Industrial Classification for National Economic Activities" (GB/T4754-2011), and was conducted in 1200 sampling enterprises of the non-manufacturing sector countrywide.
3. Survey Methods
Non-manufacturing purchasing managers’ survey was conducted in PPS ( Probability Proportional to Size) sampling method, using the non-manufacturing sectors as the selecting layers, distribution of sample size was according to their value-added accounted for the proportion of total non-manufacturing value-added, and samples within layers and the main business revenue of the enterprises were selected by the PPS.
The survey was organized and conducted by staff members of survey offices, monthly through Online Reporting System of NBS by sending survey questionnaires to the purchasing managers of the selected enterprises.
4. Calculation Methods
Non-manufacturing purchasing managers survey involves 10 questions on production, new orders (business required), export, existing orders, finished goods inventory, intermediate input price, subscription price, employees, suppliers delivery time, and business activities expectation. Diffusion index was calculated on each question, i.e. percentage of positive answers in number of enterprises plus half of the percentage in the same answers.
5. Seasonal Adjustment Note
The purchasing manager’s survey is a monthly survey, great fluctuations of data which affected by seasonal factors. At present, time series of China's non-manufacturing PMI have met the technical requirements of the seasonally adjustment, and the sub-indices of non-manufacturing PMI data on seasonally adjusted will be released since March 2012.
(Source: National Statistics Bureau website)
