You are here: Home» Photos» Highlights

Graphics of Report on China's National Economic, Social Development Plan

Adjust font size:
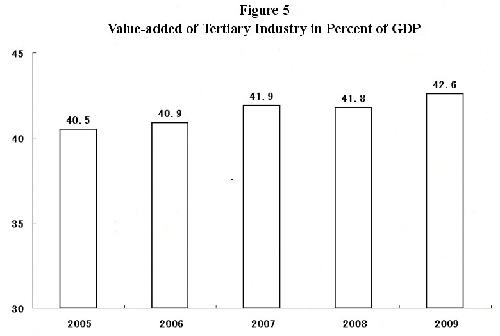


 Graphics shows the value-added of tertiary industry in percent of GDP in China from 2005 to 2009, according to the report on the implementation of the 2009 plan for national economic and social development and on the 2010 draft plan for national economic and social development released on March 5, 2010.

Graphics shows the value-added of tertiary industry in percent of GDP in China from 2005 to 2009, according to the report on the implementation of the 2009 plan for national economic and social development and on the 2010 draft plan for national economic and social development released on March 5, 2010. [Xinhua] 


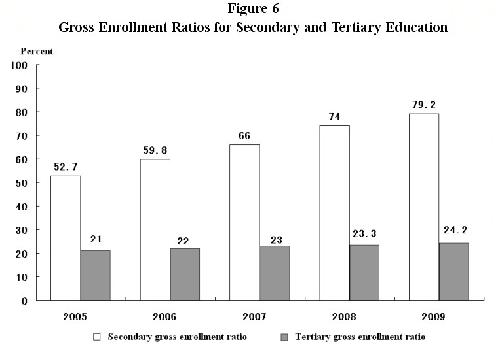
 Graphics shows the gross enrollment ratios for secondary and tertiary education in China from 2005 to 2009, according to the report on the implementation of the 2009 plan for national economic and social development and on the 2010 draft plan for national economic and social development released on March 5, 2010.

Graphics shows the gross enrollment ratios for secondary and tertiary education in China from 2005 to 2009, according to the report on the implementation of the 2009 plan for national economic and social development and on the 2010 draft plan for national economic and social development released on March 5, 2010. [Xinhua]


Graphics shows the progress in major post-wenchuan earthquake recovery and reconstruction tasks in China, according to the report on the implementation of the 2009 plan for national economic and social development and on the 2010 draft plan for national economic and social development released on March 5, 2010.
     1   2   3   4